Portfolio of Luis Alves, UI/UX Designer from Portugal.
Developers plaftorm website
Introduction
The company promoting this developers platform as several products that have achieved a maturity level that allows the creation of api’s for other companies em developments teams use.
1. Emphatize
In this step I scheduled 1 on 1 calls with 5 developers of the company to gather their insights and experience about this type of platform. 4 of the 5 interviewed developers had already used at least one developer platform in the past. They shared their opinions, visions and pain points and from this information I could understand the following:
Their need for something very clear in terms of navigation and very clean in terms of look
Clutter could bring confusion to the code presented
The ability to choose between a white and a dark theme
The ability to see snippets of code and copy them to the clipboard clear of any text styles
The ability to search
This was my second time creating a developers platform, so I could also feel empathy based on my personal previous experience.
I also used this type of platform in the past, but got emerged again in this “world” by registering and checking developers.shopify.com; marvelapp.com/developers; developer.android.com and a few others.
2. Definition
The objective for this website was to create a simple, easy to use, code repository and implementation instructions for products api’s.
2.1. Problem statement
Developers want a clear and clean website with information and code to help them implement API’s.
2.2. Requirements
As a user on the landing page I should be able to:
See the key areas of the API’s
See short information about the scope of the platform
Be able to request access
Be able to login
As a user, after login I should:
Be able to create an API key
Be able to view documentation for each key area
Learn about API authentication
Be able to search
be able to change the theme to both light and dark
be able to copy snippets of code free of any text styling
3. Ideation
3.1. Sketches
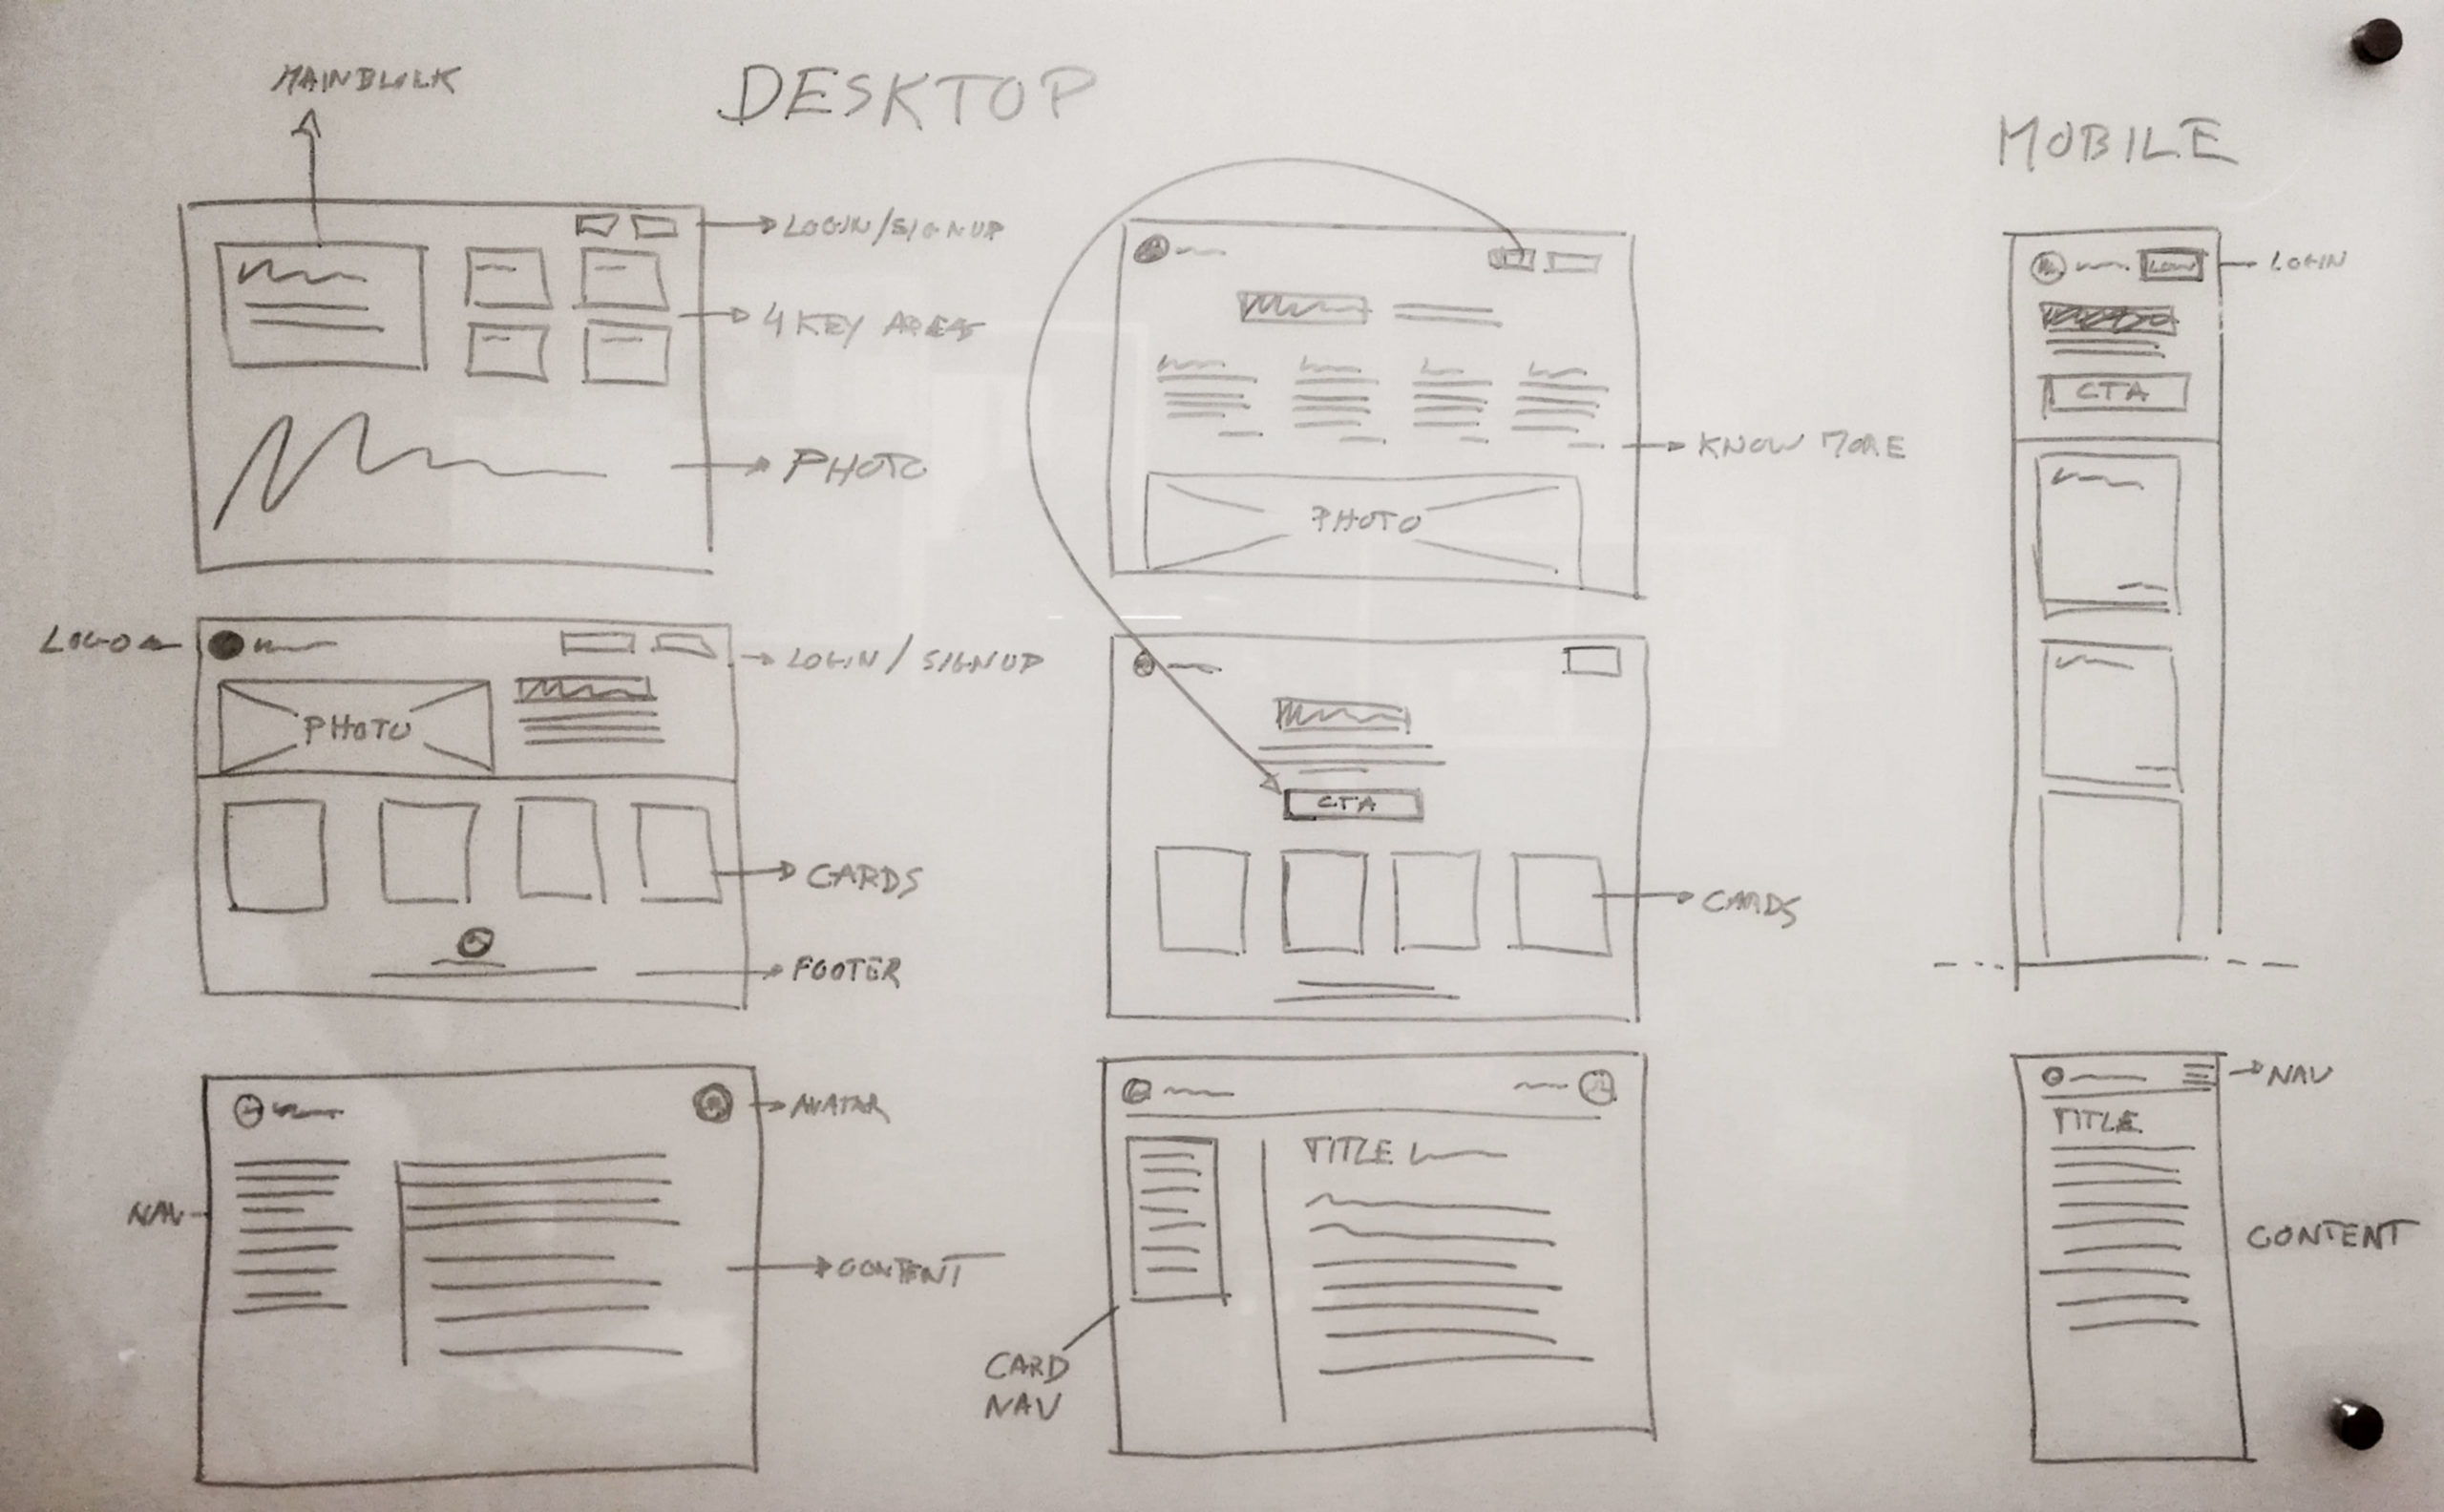
After the definition quick sketches were created to validate some of the ideas.
Fig. 1 - Whiteboard quick sketches.
3.2. Mockups
Mockups with UI design and color were also completed. The proposals were presented and the team, that included developers, chose one of the proposals to go to prototype phase.
4. Prototype
A CSS and HTML prototype was created based on the Sketch app mockups.
5. Test
5.1. Usability testing
5.1.1. Objectives
The aim is a qualitative behavioral test related to user interaction with the application’s prototype in the accomplishment of tasks proposed by a test guide. It is intended to evaluate the product in the prototype phase and answer the following questions:
Can the user get into the platform? Can the user log in to the app? Can the user understand how navigation works?
5.1.2. Sample
The sample is composed of people aged between 20 and 50 years of both sexes.
Participant selection criteria for this study were:
Age between 20 and 50 years old;
Developers as a profession;
5 users completed the test.
5.1.3. Results
No problems were registered during the tests using the HTML and CSS prototype.
6. Launch
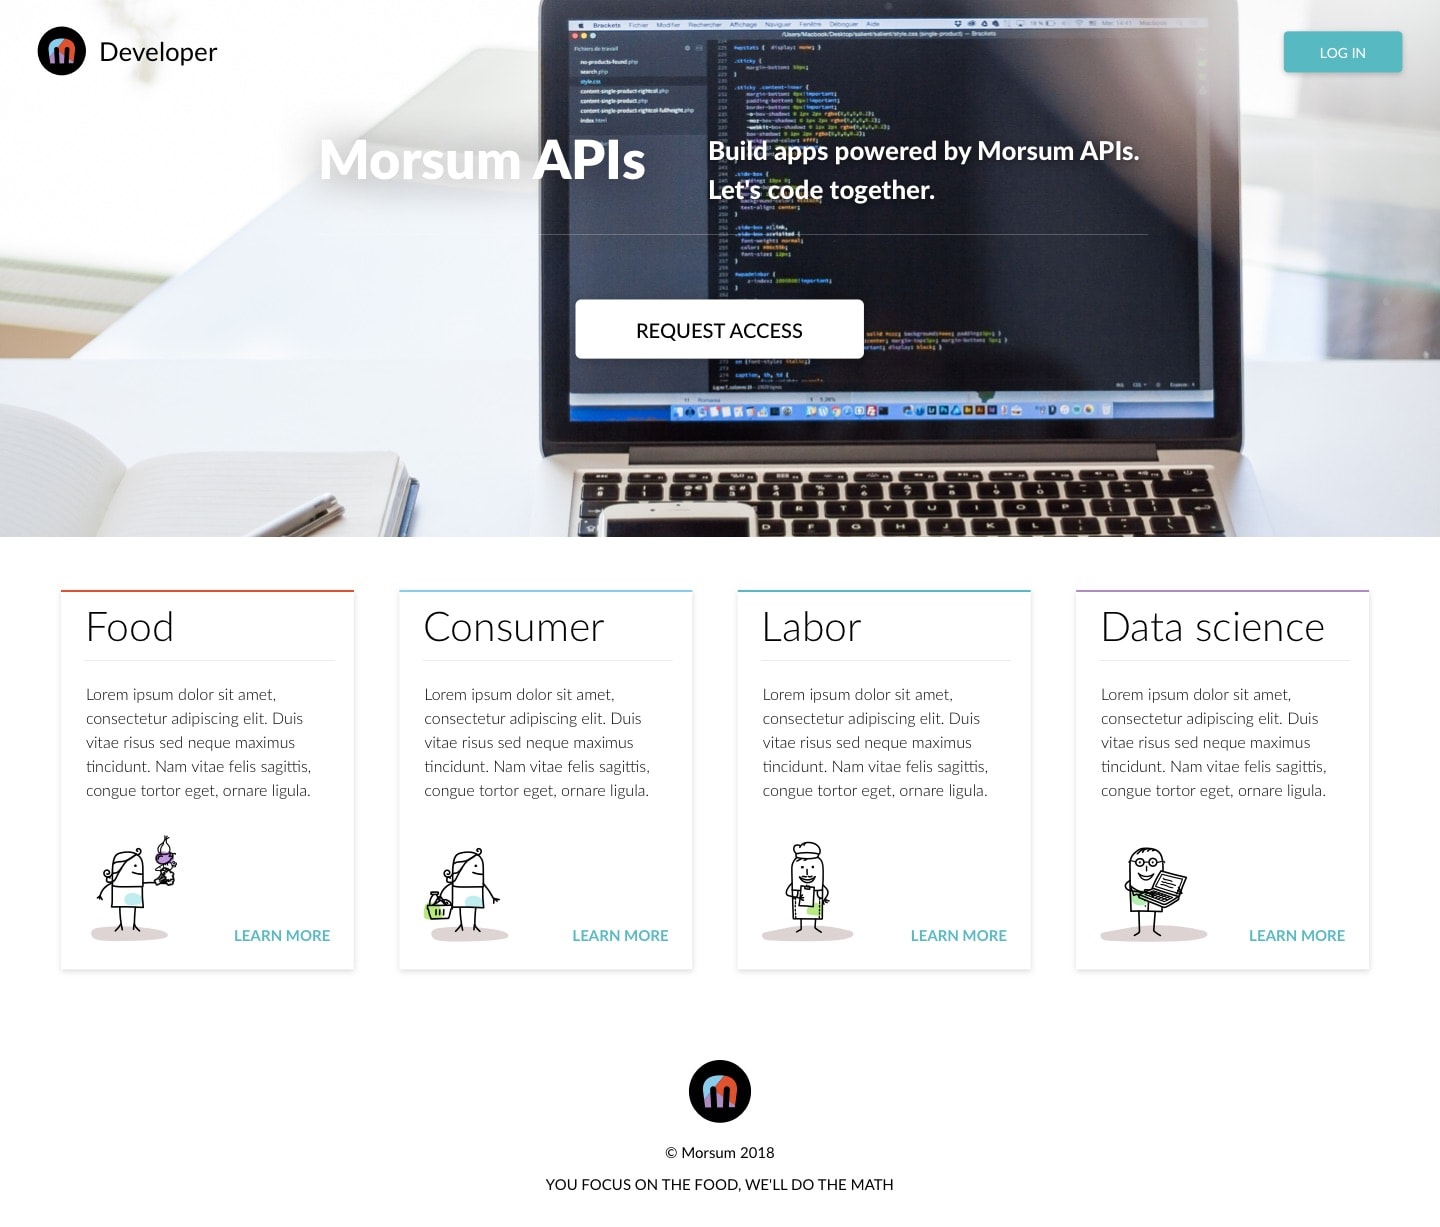
The launch product did not match the prototype. The description of the key areas isn’t presented, and the “LEARN MORE” CTA is also not displayed. The product team had no information to insert and didn’t found it relevant.
Fig. 2 - Final landing page version.
The key areas "Food, Consumer, Labor and Data science", are hanging there... so this raised a question to me.
Will users want to know more about them? Will the users click them?
Let's test!
6.1. Heatmapping test
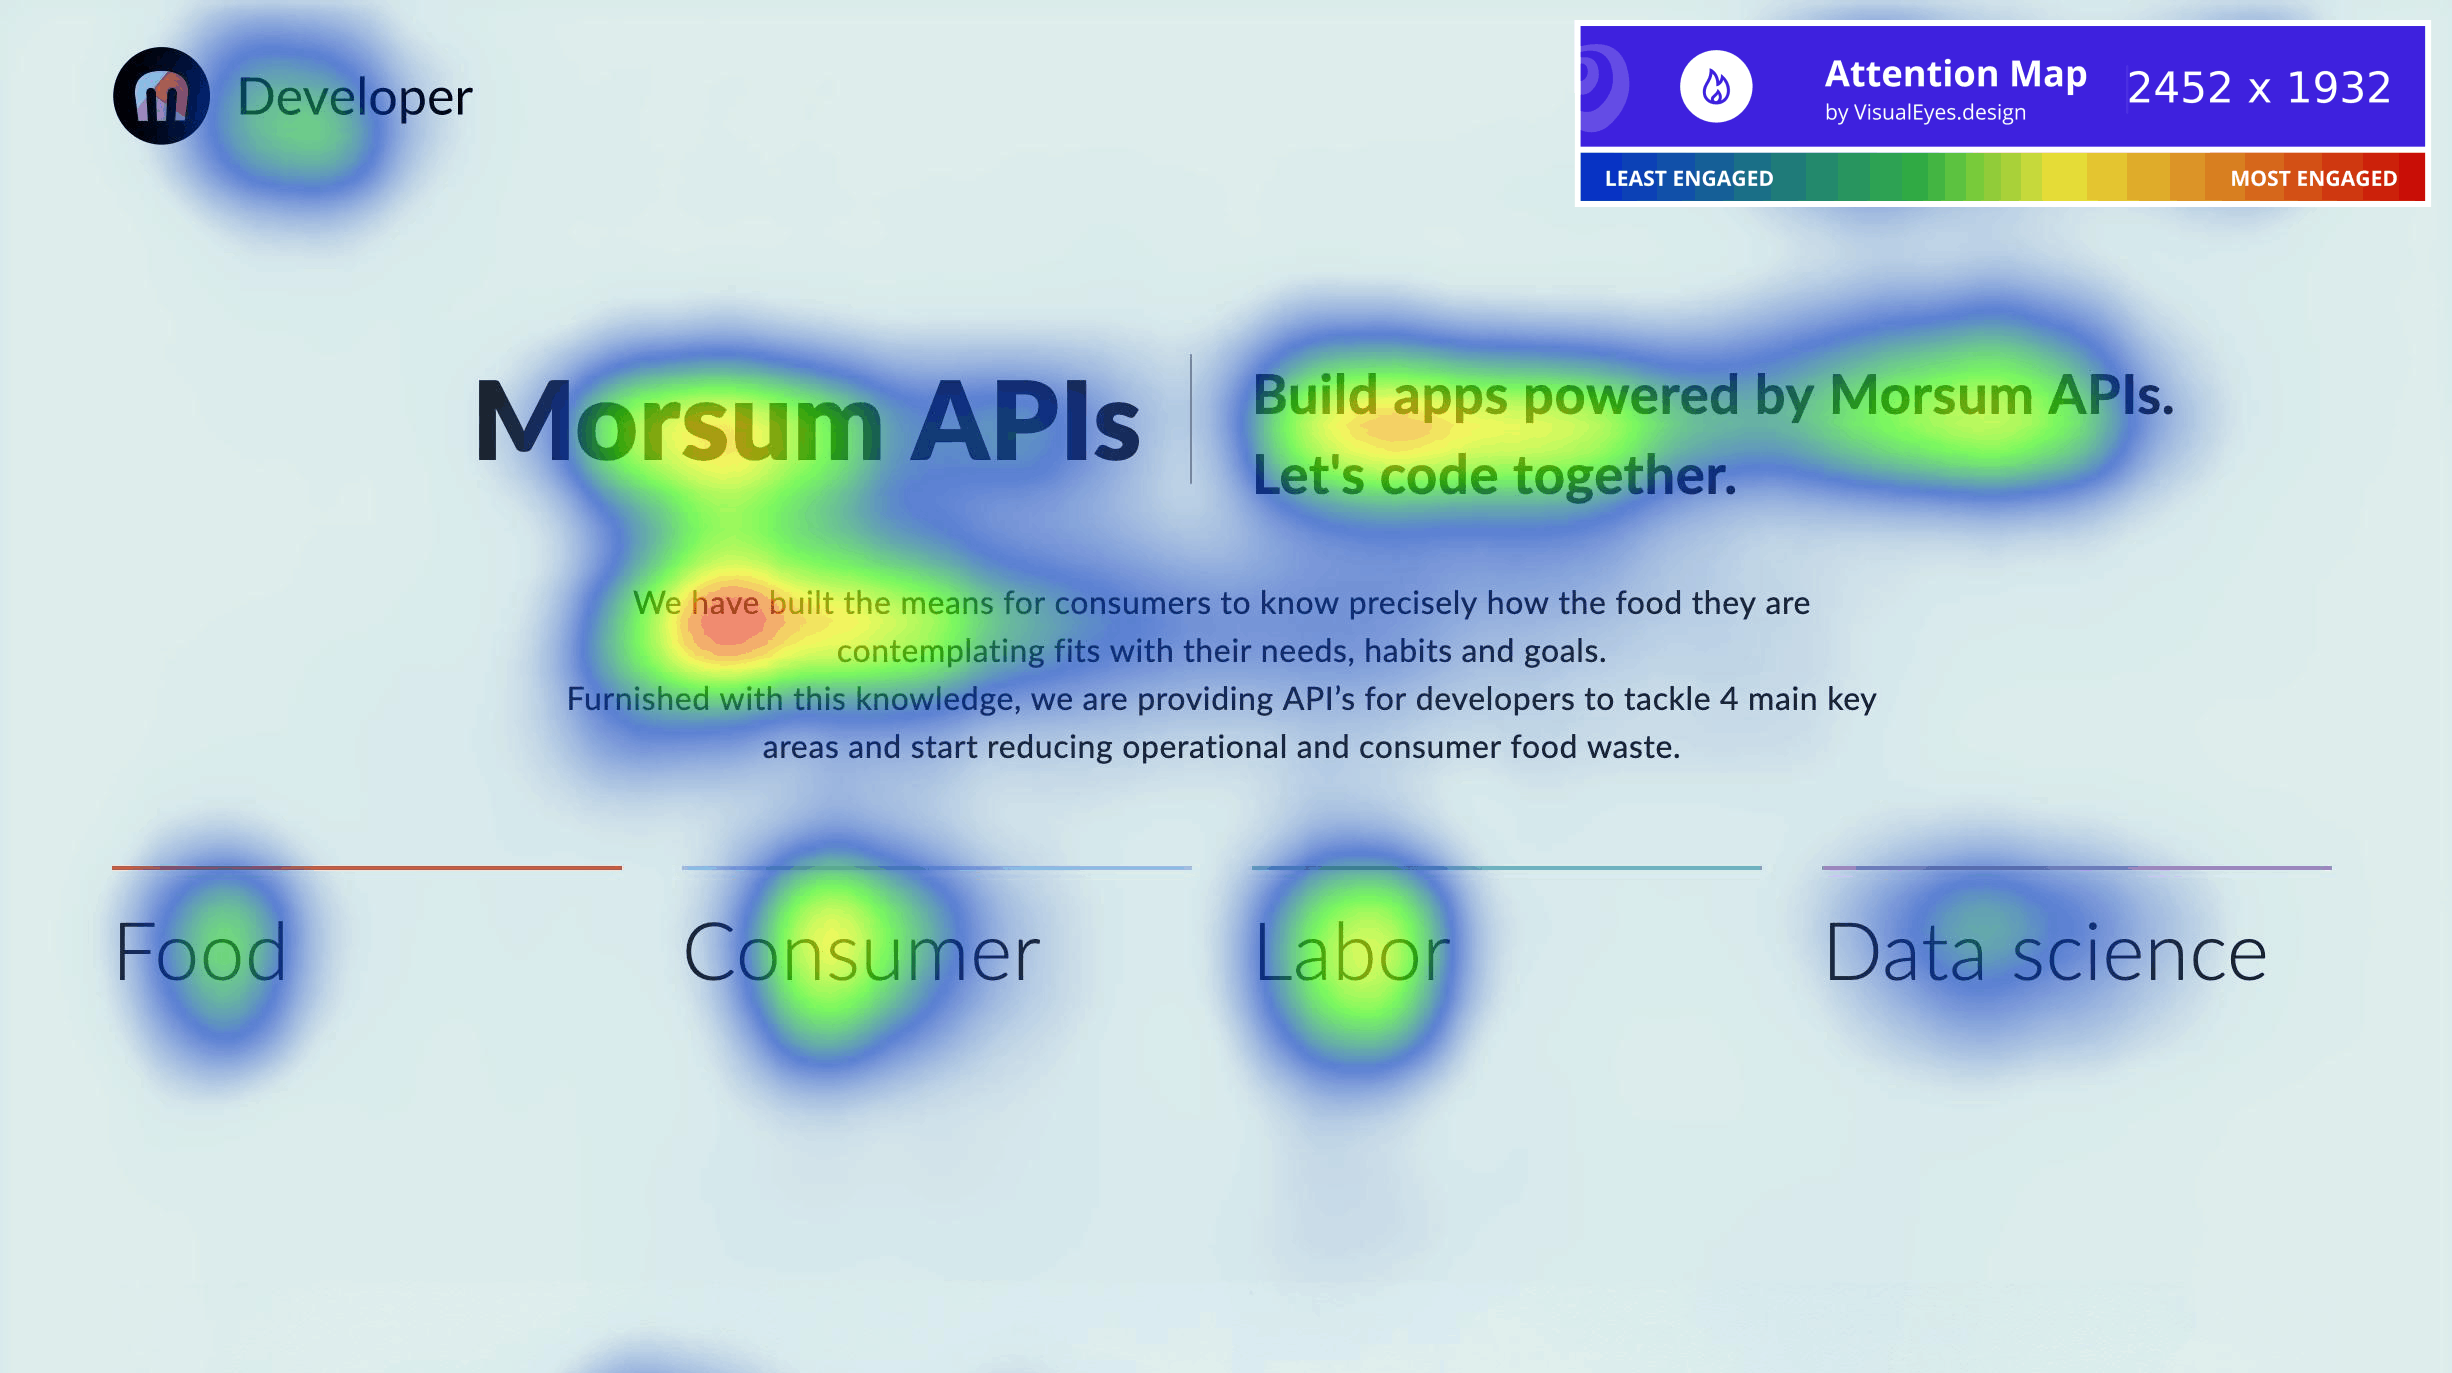
To start, just for curiosity I used a AI tool called VisualEyes – “Our intelligent algorithms predict the user behavioral patterns based on more than 20,000 data from our large scale studies”.
Using this tool I could get a prediction of what a real heatmap could look like, mainly because I’ve personally compared it with real data and it’s quite good!
Fig. 3 - VisualEyes attention map results.
The attention heatmap calculated with VisualEyes was in fact assigning quite a bit of attention to those key areas elements, so I decided to require a hotjar installation to validade this.
Fig. 4 - Hotjar click heatmap.
6.1.1. Test conclusions
The hotjar click map came to confirm that users are in fact clicking the key areas. The users want to know more about those items and this is a problem that needs to be addressed. These findings were reported to the product team and are waiting for resolution. Other features like the dark mode and code copy are also waiting design and implementation.